How Business Intelligence Helps Understand the AGL Community
This article explains how Business Intelligence techniques were used to analyze and understand the community behind the Automotive Grade Linux platform.
This is the second article in a series about the Automotive Grade Linux (AGL) Business Intelligence (BI) journey. It provides insights into the community analysis part of the study. The study is the result of a collaboratopn effort between Bitergia and myself.
The study applies advanced data analysis techniques to understand how the AGL platform is produced. Please read at least the first article of the series before this one.
The full study is structured into four main areas:
- AGL community
- Code activity
- processes:
This article focuses only on the community area of the study. Future articles in the series will cover the remaining areas.
The data
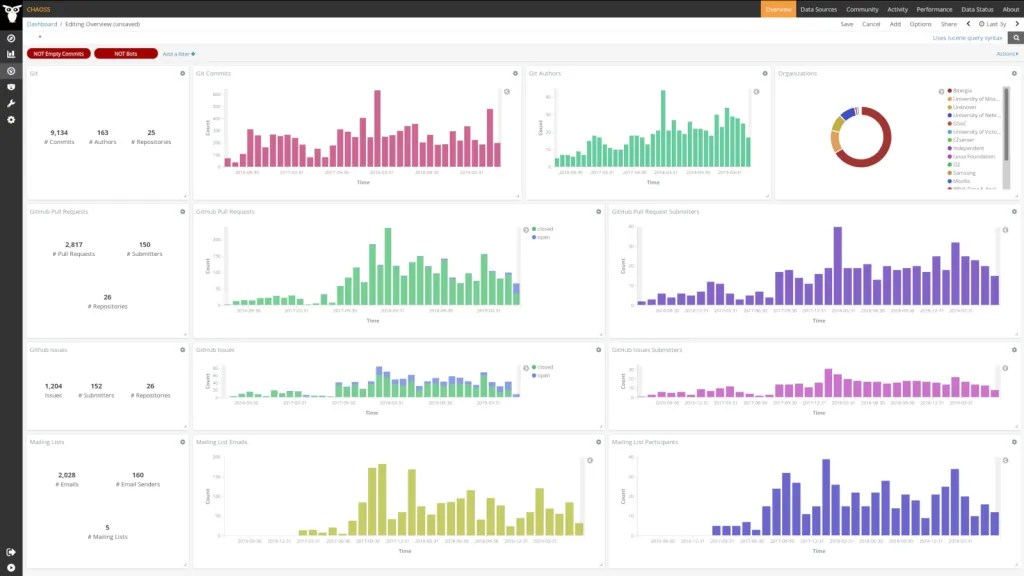
For this part of the study, where we describe the AGL community, we considered a limited set of variables. We intentionally kept the scope small to make the analysis easier to understand. We looked only at:
- Authors of commits on git
- Affiliated organizations on git and Gerrit
- Changeset/patchsets authors in Gerrit
- Code reviewers in Gerrit
These variables help us understand who contributes, from where, and how teams interact with the code base. From the analyzed data, we evaluated:
- Time zones and regions where the community members work from
- Contributions and potential patterns over time
- Which repositories attract which authors and organizations: who does where
AGL pipelines involve several tools. However, in this first iteration, the study relies on only two data sources:
- Gerrit, used for source code management and code review
- Jenkins, used for building software
In a second iteration of the study, adding data from ticketing systems, mailing lists, meetings, and Discord would provide a richer and more complete picture of the community.
Why the characterization of the community matters
Characterizing open source communities is not new. There is extensive research and many public reports about it. Please check Bitergia’s Radar Reports, to get an idea. These analysis are less common in commercial environments, even though it can be very useful.
Automotive software production often involves teams made up of people from different:
- cultures
- companies
- roles and profiles
- locations and time zones
- others…
Each team or department may work in a different way. Understanding who is involved, where they are, and how they work is one of the first steps in any Business Intelligence journey. I often refer to this work as heavy lifting. It is sometimes ignored, but it is essential for correctly interpreting activity and process metrics later.
AGL community profile
In this case, characterizing the AGL community is relatively simple. Most contributors share a fairly homogeneous profile. The AGL characterization page of the study summarizes the analysis based on the selected metrics and variables. It provides a data-driven description of the AGL project.
Part of that description focuses on the community. It shows that AGL is mainly developed by professional contributors working for organizations, rather than by individual volunteers. You can find a summary of this analysis in the section of the report that presents the conclusions about the AGL community profile.
Put the focus away from individuals
In this study, we do not analyze individuals. We focus on teams, organizations, roles, processes, and patterns. We do collect data at the individual level because tools like Gerrit and Jenkins expose it. However, we never publish or discuss information that could be used to evaluate individual performance.
In open source projects, it is common to publish lists such as top contributors or top reviewers. We deliberately chose not to do this. AGL staff can access contributor-level data directly through the dashboards when needed. They are trusted by the community to handle this information responsibly.
Our goal is to analyze the performance of the software production system, its environment, processes, and practices — not the performance of individuals. This approach applies not only to this study, but also to our commercial services. In some countries, sharing this type of data is restricted by labor law. This is one of the principles we have carried from our commercial work into our open source activities.
Taking advantage of the tool’s strengths
One of the strengths of the Bitergia Analytics Platform, which is fully based on GrimoireLab, the CHAOSS project, is its identity management module called SortingHat.
SortingHat can merge identities from different data sources into a single profile. It manages changes over time and supports multiple identifiers for the same person. This is essential to correctly understand:
- who contributes
- in which role
- and on behalf of which organization
It also enables complex visualizations that combine data from different sources while keeping the data accurate and up to date. Different organizations focus on different parts of the code base. Some work on platform integration, while others focus on specific automotive components.
In commercial environments, extending this profiling to teams and tracking how it evolves over time is very powerful. Different entities may have different practices, development cultures, and working methods. This capability helps us study relationships between people, organizations, and the production system, and to better characterize collaboration.
Next steps on the community section of the report
The community profile identified in this first iteration helped us better understand metrics related to activity and processes. It also showed that these kind of community metrics should not be analyzed in isolation. In a second iteration of the study, we plan to explore new lines of work, including:
- Team, department, business unit, and organizational structures, including roles, seniority, and expertise
- Code review patterns, such as time to merge, number of review iterations, and review efficiency
- The impact of project-level practices and policies on how different groups interact with the system
Some examples of community characterization can be found in the popular report series, published by Bitergia, under the commercial name Radar Reports. A significant part of this knowledge can be adapted to commercial environments, which is an essential part of the work we do at DPA.
Summary
This article showed how community analysis plays a key role in the Business Intelligence journey applied to Automotive Grade Linux. By focusing on teams, organizations, roles, and collaboration patterns — instead of individuals — we can better understand how the AGL production system works and how different contributors interact with it. This context is essential to correctly interpret activity and process metrics.
This is the second article of a series that covers the entire study. More articles in this series will follow, covering other areas. If you are new to this series, please read:
- The first article of the series, an introductory one.
- The study itself, locate at the AGL wiki
- The report included in the study.
