From data to insights. Applying data analytics to AGL production environment
Setting the Stage
For some time now, Bitergia and I have been collaborating on applying Business Intelligence (BI) principles to the complex production environment of software-defined products. Our approach mixes Bitergia’s deep experience in data analytics, specifically applied to open source software development, with my own background in embedded and automotive environments. However, this area often presents a unique challenge: automotive companies frequently do not view this data-driven approach as essential. Consequently, there are not many examples available that can provide decision-makers with a clear idea of the substantial benefits this kind of analysis can bring to their development processes.
Coming from the open source world, we are naturally used to showcasing what we do in the open. Yet, as a service company, there is very little client-specific work that we are able to publicly demonstrate. To tackle both of these challenges simultaneously—the need for public examples and the desire to showcase our work—we made the decision to invest our own time in applying our BI expertise to an open source project.
This investment serves a dual purpose. On one side, we would create a tangible asset that embedded and automotive companies can evaluate, supporting what we show and offer in pre-sales conversations. On the other side, we fulfill a core open source principle: helping the target project to use data to inform their decisions and continuously improve their software production.
Click here to read the study: Business Intelligence Journey Applied To The Production Of The AGL Platform
Why We Chose AGL
The decision to choose AGL (Automotive Grade Linux) open source project as the focus for our deep-dive study, was simple and strategic. I was already familiar with the project, having collaborated with it in the past. Furthermore, I have attended their events on several occasions and have actively promoted the involvement of companies I worked for in the past.
AGL stands out as an excellent candidate because it has a well-defined delivery process and ships a functional in-vehicle platform. They perform necessary testing on hardware and support various platforms and architectures. Beyond integrating and testing the platform platform, they also develop software components for automotive use and maintain strong roots in upstream open source projects.
Given all these factors, I believed they were a great candidate for this kind of BI effort. On top of that, their staff and core contributors have been highly supportive and assisted us throughout the entire process.
The Journey: From Exploration to Deep Dive
Initially in 2024, we started the study focusing solely on applying data analytics to evaluate AGL’s delivery process. As the year progressed, we quickly realized that extending the study to evaluate AGL’s activity around code would be highly beneficial to the community. Therefore, during 2025, we decided to add code review analysis to our scope. Because the study was already dense, we decided to play conservative in this code review process analysis initially. It wasn’t until the analysis period, specifically in 2025Q3, that we decided to dedicate some focus to characterizing the AGL contributor. The necessary data was already present; we simply needed to “wear the right glasses” to identify and interpret that data.
Another key decision we took early on was to initially focus only on the first stage of the Business Intelligence Journey: descriptive analytics. We plan for a second iteration: if our work proves meaningful and useful for both AGL and for ourselves, we will then move into diagnostic analytics.
Ultimately, after evolving our scope throughout the process, we structured the study for this first iteration around four core areas:
- Community: This area was studied to characterize the AGL contributor, allowing us to identify their profiles and interpret the human element behind the data.
- Activity: This analysis extended the study to evaluate AGL’s overall activity around code (git commits and builds)
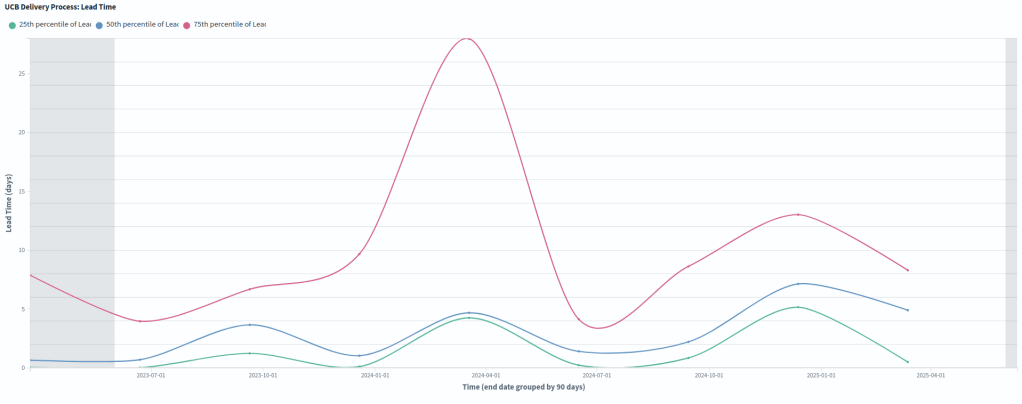
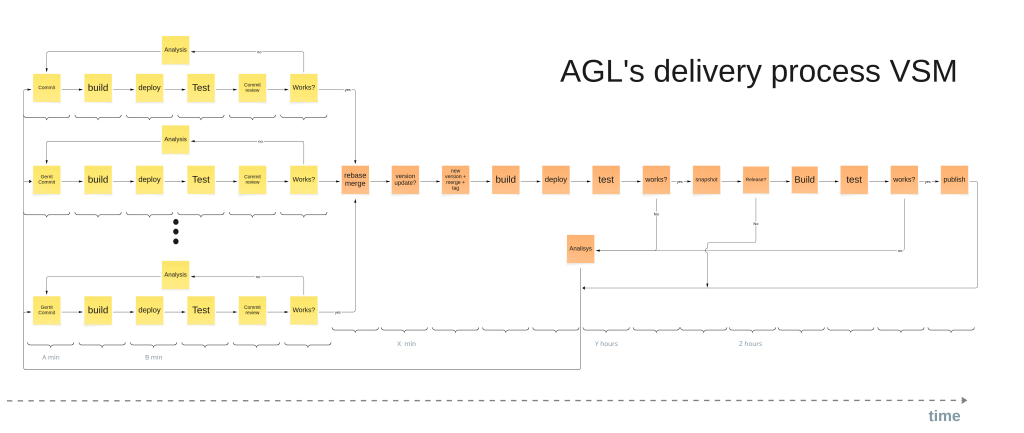
- Processes: This focus area included a detailed analysis of the delivery process (which is explained in depth for new readers) and the code review process.
The Challenges of Getting the Data Right
As we started obtaining the initial results, we immediately began facing typical challenges we encounter in commercial customer environments: primarily, ensuring the consistency of the underlying data. Furthermore, we went through the necessary learning process required to interpret the data correctly, which allowed us to design a data hub and create the dashboards that would be truly useful for the consultants. This exploratory phase was time consuming for a study developed on best-effort basis, but crucial because it allowed us to scope the overall study and understand the core differences and similarities between the AGL analysis and the consulting efforts we have previously undertaken.
During the first half of 2025, we built upon the groundwork laid in 2024 to finalize the data hub and create the dashboard plots. These dashboards were the tools that the consultants—especially myself—would use to meticulously analyse the AGL production system. The second half of 2025 was largely invested in the analysis itself, which involved continuously adjusting the underlying data to ensure it accurately reflected reality as we performed our review. We then focused most of our energy in October and November on creating the final study document on AGL’s wiki, and fine-tuning the analysis. Finally, December is the month where we are communicating the study and collecting valuable feedback from the AGL community, as well as practitioners.
The Study’s structure
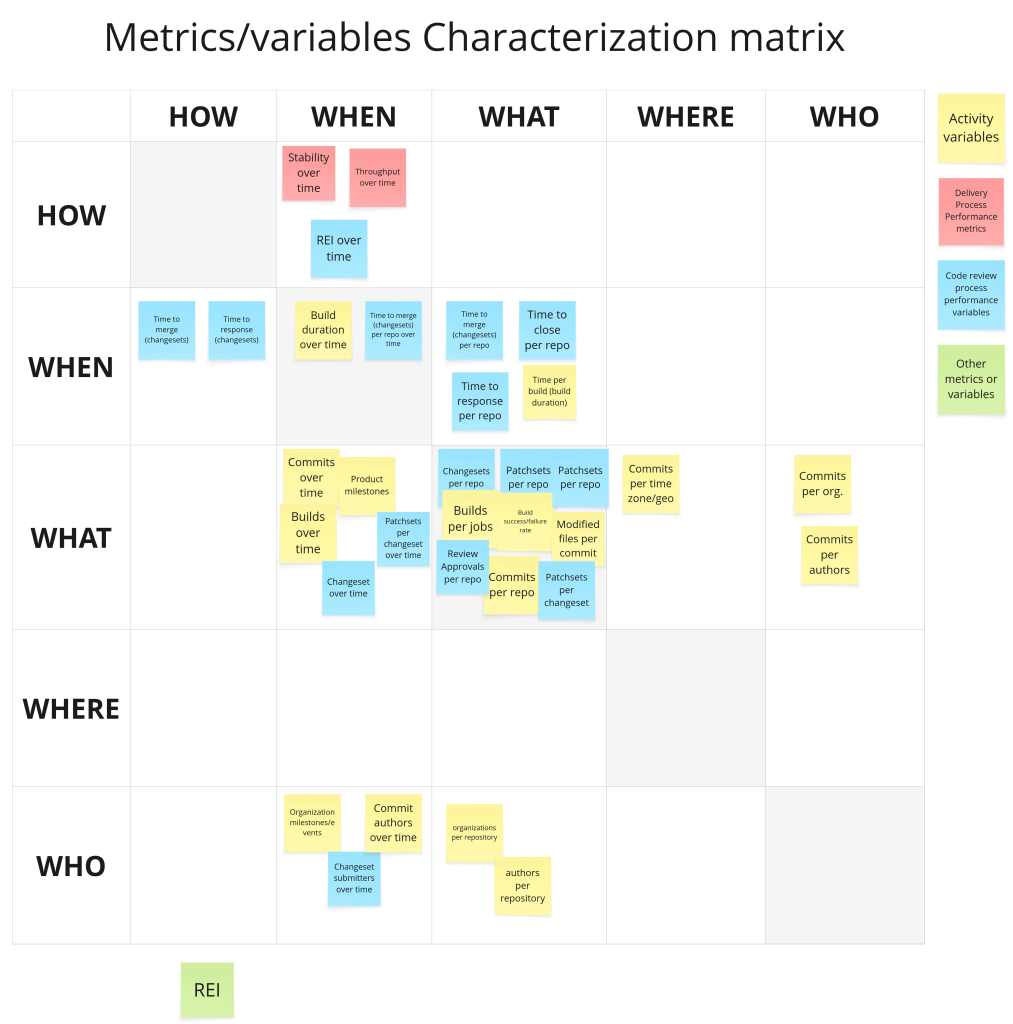
The structure of the study ensures clarity and accessibility for practitioners and newcomers alike. Within the wiki, for each section of the study, we have defined the specific metrics on one dedicated page. Following this, we have published the most relevant plots (graphs) on separate pages.
We made sure that the delivery process section of the study includes more comprehensive details and explanations, as we believe this content is likely to be new for many readers.
The following section of the study focuses entirely on the analysis itself, beginning with a summary of all the metrics considered, followed by the AGL characterization—which represents the descriptive analysis itself. It also includes a necessary process focused on moving from quantitative to qualitative analysis, which is required for applying continuous improvement processes at scale.
The subsequent section corresponds to the final report we created, which includes 10 concrete conclusions we were able to extract out of the data. The study finishes with information about the authors who conducted the analysis, as well as references for those readers interested in further details about the specific processes and techniques we applied.
I would like to thank the AGL community, and specially Jan-Simon M., for their continued support and for believing in the value of our work. I would also like to express my gratitude to my partners who contributed to this effort: the entire Bitergia Team, and specially to Luis Cañas and to Igor Zubiaurre.
Next Steps
Moving forward, during the coming days and weeks, we will be actively collecting feedback from the AGL community and reflecting it as questions on the study’s dedicated questions page. Ultimately, we will use this input to provide a set of recommendations to the AGL community in the corresponding section of that same page. These two sections—the questions and the recommendations—should serve as the trigger for the diagnostic analytics phase, which we are referring to as Iteration 2 of the study.
I invite all interested parties to read the report section of the study. If you find the report interesting and want to dig deeper into the analysis, I recommend checking the AGL characterization page which will lead you directly to the relevant graphs. If you are a practitioner or are otherwise interested in this topic of applying BI to open source software production, I recommend that you start reading from the beginning and surf the wiki guided by the ToC, following the proposed structure.
Finally, feel free to contact me directly with your thoughts. However, it will be most efficient to join the AGL CIAT calls or write your questions and comments directly on the agl-community-dev mailing list.
Additional articles will follow this one, explaining different aspects of the study. Stay tuned!
- Check the second article of the series, providing insides about the characterization of AGL’s community
- There is a third article providing insides and recommendations about AGL’s code activity.

3 thoughts on “Automotive Grade Linux Business Intelligence Journey: Introduction”