This is the first of a two articles series about the topic. I recommend to read this one first. Click here to open the second one. UPDATE June 2023 – I have also done some talks and workshops on this topic, like you can find in these slide deck.
Introduction
As many other graduates in physics, I have passion for Feynman. His explanations of complex concepts made them seem reachable for students like me up to a point where you develop a taste for simplicity. Producing software at scale is complex, but if you have some basic and often simple concepts clear and you keep passionate about simplicity, you not just be able to better understand the management challenges ahead of you but also to communicate them more effectively, as well as the potential solutions.
As manager and currently consultant, I always feel that a significant part of my job is to put focus on simple things that are often forgotten or ignored. I keep in mind Feynman words and try to stick to them.
“If you can’t explain something in simple terms, you don’t understand it.”
Richard Feynman
These series of articles are an attempt to explain in simple words how to approach software product delivery performance process metrics in production environments at scale. I will use automotive as main example because it is the one I am currently working on.
Disclaimer
The ideas and practices you will read in these two articles are not mine. I just summarize other people ideas, structure them and add some bits here and there based on my own experience. You will find key references on this topic at the end of this article.
Simplicity, when done wrong, leads to inaccuracy and sometimes to a disconnection with reality, which makes the concepts about to be explained, inapplicable. If you see any of that in this article, please point me to it and I will work it further. I use some of these explanations on my daily job so, in the same line, if you help me to improve them, I would really appreciate it.
Why the software product delivery process?

When you analyze any software portfolio life cycle developed at scale in industries like automotive you can identify several phases (check the image).
From all of these phases, the delivery process is the one where you can apply more engineering by making it systematic. Continuous Delivery is becoming increasingly popular as a set of principles and practices to do so. It is also important to add to CD a release approach that meet your needs. If continuous deployment does, then it should definitely be the selected one.
I will concentrate on the delivery phase of the product life cycle.
Approach to follow
As Continuous Delivery gets more and more traction, the understanding of any software product delivery process as an engineering process increases, especially at scale. This necessarily leads a need to strengthning data driven decision making processes within organizations.
Telemetry is applied to areas like operations or customer support, for instance. Data is collected, aggregated, plotted and then used as input to support analysis and decision making processes. This way of using data is very similar to what science was about in its early days, based on observation. Yes, sophisticated, but observation after all.
That is a useful approach specially for simple systems but it is limited when the goal is to support decisions meant to affect significant parts, or even the entire, delivery process, specially when this process is complex.
At scale, we know that optimizing locally does not necessarily leads to global improvements. At the same time, in order to optimize a system globally, we know that we might not require to optimize each one of its stages, in this case, of the delivery process.
I have invested energy a few times to persuade executives and managers that a “bottom-up” approach (from local to global), frequently based on telemetry, needs to be complemented with a “top-down” (global to local) approach, a more systematic approach, a more “scientific” one.
Sometimes I refer to this approach as applying “system thinking”. This is due to the rejection that I have witnessed among managers to anything that resembles “science”. I believe it is because they perceive it as too theoretical. Have you experienced something similar?

In any case, as many reputed consultants in product development often points out, what you will read about here is nothing but an application of the scientific method to solve problems. When it comes to data and how it should support decision making processes (continuous improvement), I have noticed that it works well to refer to metrics vs telemetry.
In summary, when I try to explain the need to invest in product delivery process performance metrics to support decision making processes, using a continuous improvement approach, I simplify the message as described in the picture, which I often refer as following a top-down vs a bottom-up approach. Not the best label, but easy to remember and communicate, specially to executives.
Five not-so-simple steps
I rarely have more than one shot to justify the rationale behind the approach I will describe here, to apply a data driven improvement kata using software product delivery performance metrics as guidance. This is why I have structured my approach in 5 “simple steps”:
- Model your delivery process.
- Create a mathematical construct.
- Measure and analyze.
- Apply a data driven improvement kata to optimize the delivery process.
- Add complexity to get closer to reality. Then go back to point 1.
1. Model your system
Like scientists do, we should start our approach with a simple model, the simplest possible abstraction of out delivery process that can provide us context and enough valuable information to start with. If we cannot understand the behaviour and performance of a simplified abstraction of our delivery process, we will not understand the real process, which is significantly more complex.
What is the simplest model we can use to describe our delivery process? I start with this one…

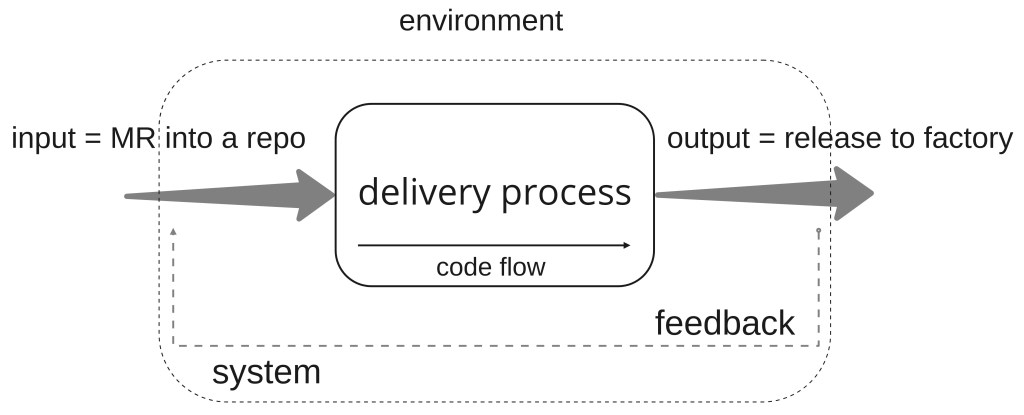
Depending on how advance the auto-maker is in the adoption of a software-first mindset as well as the organizational structure, the development teams will have and end-to-end ownership of the software shipped in the vehicles or on the software they release (hand-over) to those in charge of the deployment in production (production in the factory including end-of-line testing). Usually there are additional stakeholders involved. So to simplify, we will assume that the delivery process ends with a release process to the factory.
The delivery process begins once the software is developed, that is, when the developer considers she is finished and produces a merge request to a repository, which is part of the product inventory (repository that contains the software that ends in the product or that is necessary to product the product). This assumption can be a matter of debate. Again, this is about making things simple. Let’s move on and hopefully you will agree with me that is a minor point when it comes to achieving the overall goal.
With the above in mind, we can model our delivery process as…
Now that we have described our delivery process in the simplest way possible, we will go over the rest of the steps. The goal is to use this model to describe the process and work with it. Once we understand it and we are able to improve it, we can add complexity. As mentioned, start simple and add complexity and go from global to local.
2. Create a mathematical construct
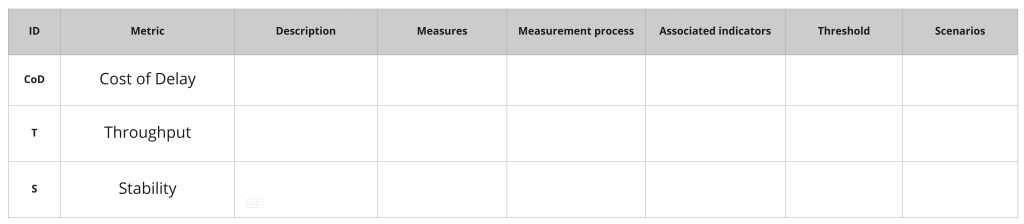
We will use math to explain the behaviour of our system and the performance of the involved process. Our mathematical construct will be formed by three metrics, which are:
Throughput and stability characterize the performance of our model (delivery process) in a simple way. They are easy to understand and, as we will see later on, in the coming article, they work well for simple and complex models.
There are plenty of engineering disciplines where stability is a popular metric. Software product professionals familiar with agile know these concepts from manufacturing for instance. Those of you familiar with physics or engineering areas where physical systems manage some liquids flow or discrete elements, like networking or water supply systems, are already familiar with the concept of throughput.
The goal of this article is not to go deep into these metrics. I will only provide the minimum level of detail to understand them. At the end of the article I provide several references if you are interested in further details and justifications. I strongly recommend you to go over them.
Wikipedia mentions that Cost of delay combines an understanding of value with how that value leaks away over time. It is “a way of communicating the impact of time on the outcomes we hope to achieve.”[1]
“If you only quantify one thing, quantify the cost of delay.” – Don Reinertsen
This series will not concentrate on this metric. CoD does not characterize our delivery process although it is related to the other two metrics. CoD refers to the entire product life cycle.
Why did I mentioned it then?
I always recommend to add a business related metrics to whatever software product production process performance metrics you use for, at least, the following reasons:
- Relates product level decisions with business impact as well as business decisions with impact at product level.
- It relates business decisions and their impact with engineering activities and improvements.
- Software developers take better decisions when they understand their impact in the overall business.
- It helps executives to understand the profound benefit that decentralization have when it comes to many type of decisions.
- It works as antidote against old school managers.
There are other popular business metrics that could also be used, by the way.
Dave Farley mentioned in one of his videos, published a few months back, the following: “Stability measures the quality of the output. It refers to building the thing right.” and ” Throughput measures the efficiency with which we produce the output. It refer to building the right thing.”
Stability and Throughput as metrics are becoming increasingly popular, specially after the publication of the book Accelerate, which summarizes the findings of the State of DevOps Report up to 2019. You can find this reference in the Reads section of this site. I mentioned in a previous post why I believe they are the right ones for the job.
The measures that describe these two metrics will be:
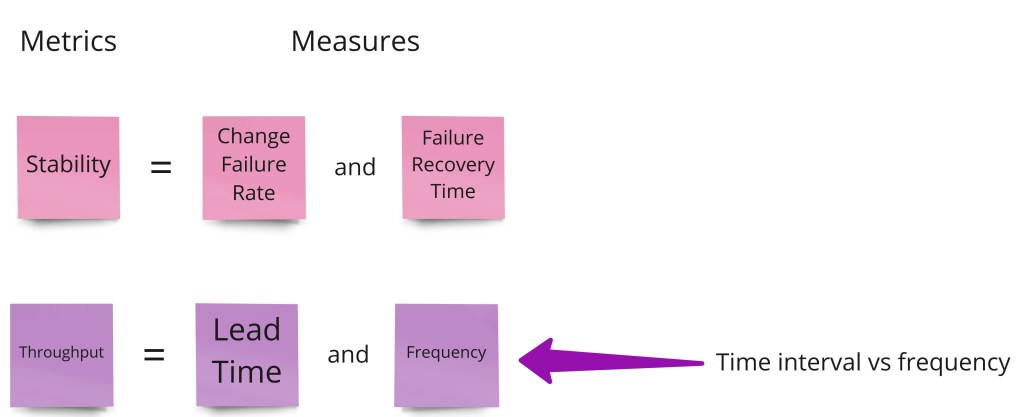
- Change Failure Rate provides an idea of the changes (input) that did not lead to any deployment or release (output) so they require remediation actions.
- Failure recovery time provide an idea of the time required to detect and remediate a failed change to a new deployment or release (output).
- Lead time provides an idea of the time that a change (merge or pull request – input) takes to produce a deployment or release (output).
- Frequency provides an idea of how often changes are released or deployed. Time interval is the inverse of frequency. We will use it for practical reasons instead of frequency. Time interval provides an idea of the time between successful changes applied to releases or deployments.
One interesting point about measures are the units. These measures have simple units. This is one of the reasons for using Time Interval, for instance, instead of frequency.
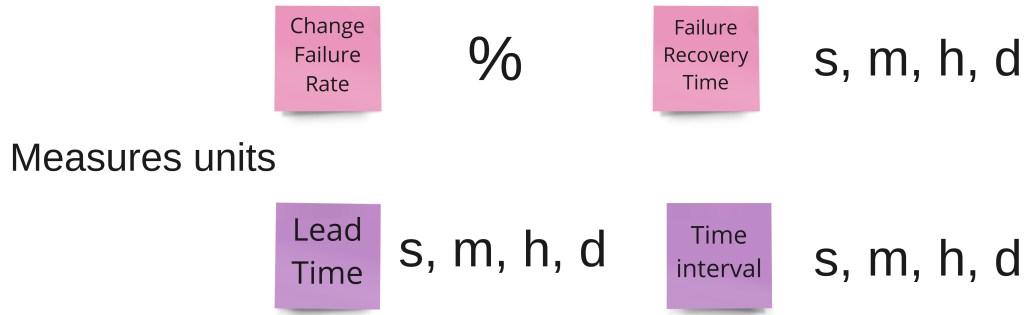
The units are also easily adaptable to delivery processes related with different industries or types of products. For instance, lead times are very different for a mobile app compared to a operating system for an automotive infotainment platform.
Looking for simplicity, we will use averages and standard deviations as the way to characterize the data sets from our measurements, taken over a period of time. Obviously this will not be the case for the Failure Rate.
My recommendation is that you start with these two metrics and, step by step, introduce further ones if required. Remember that less-but-meaningful is more, and that, at scale, the hard part is to drive changes using the metrics as a part of a continuous improvement culture. In other words, people over metrics, tools, technology…
3. Measure and analyse
3.1 Quantitative analysis
In our simplified model, the different measures should not be hard to identify. When dealing with the input, we will need to dig into our SCM to find out when the code is submitted (MR/PR). When dealing with the output, we will identify in the binary blobs storage tool when the right binary is tagged as release. Those two events will be all we need to define the measures that will characterise our metrics.
Be careful with time zones as well as error propagation during conversions. If you have access to data scientists or somebody with a strong competence in math, ask for advice on these points. Please consider that our model will increase in complexity and other people might be in charge of extracting the data for you. At some point in time you will use tools to extract, process and plot the data in (semi)real time that will need to be configured properly so, despite being simple to identify, you should describe how to extract the data and convert it to the right units in detail to avoid problems later on.
Validate your results and their usefulness with simple tooling before automating the process with more complex tools. Do not be ashamed of using something like spreadsheets at first or an even simpler tool. Learn and validate first.
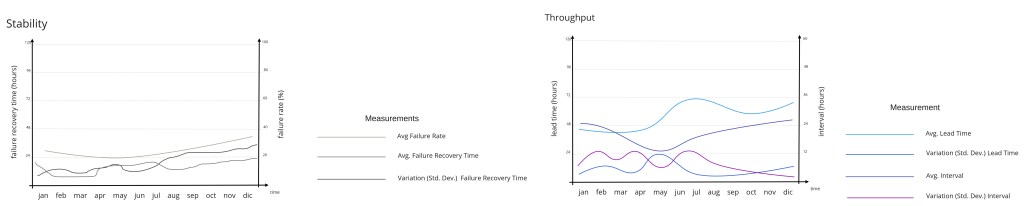
Plot the data using a timescale in the X-axis that is appropriate for your environment. It is hard to guess which one will be the most useful range so I suggest you to try different options. For simple applications that range might be weeks, while in the case of an automotive platform, it might be months or even quarters, sadly. Different visualizations might lead you to slightly different conclusions so explore your options.
Once you are able to get the right data in a reliable and consistent way, so you can determine your Throughput and Stability for any desired “point in time”, you will be ready to go for further quantitative analysis.
Instead of paying too much attention at the beginning to absolute values of the different measures, look for trends in the curves and what happened around:
- key events for your product or organization.
- dates when key actions were implemented in your delivery process.
Try to learn about the behaviour of your delivery process and its performance before getting too deep into trying to improve it. Having conversations with the teams instead of taking early conclusions is what I recommend. It what Steve Smith recommends too (check his book in the reference section of this article).
But in order to communicate the current state of your delivery process, as well as the target conditions across the entire organization, you will need to turn your quantitative analysis into a qualitative one. Without context, data might be useless, or even harmful.
3.2 Qualitative analysis
The first step to move from a quantitative to a qualitative analysis is to define scales (context). For each measure we will define a scale. We will assign a label to each range of values from that scale. To keep the scale as simple as possible, we will define each scale based on a single threshold.
Which value should be used as threshold? Choose one that makes sense for your organization. Check the values and choose one that will make the rest of the qualitative analysis meaningful.

As you can see, the chosen labels are High and Low for our simplest scale, based on a single threshold (value). Once you have defined the thresholds and the scales for each measure, it is time to define scenarios, based on these scales you just have created.
Following the scenarios published by Steve Smith in his book “Measuring Continuous Delivery” I created the representations below to summarize them. I strongly recommend you read this book. Many of the ideas you will see here and in the next article were either taken from or inspired by it.
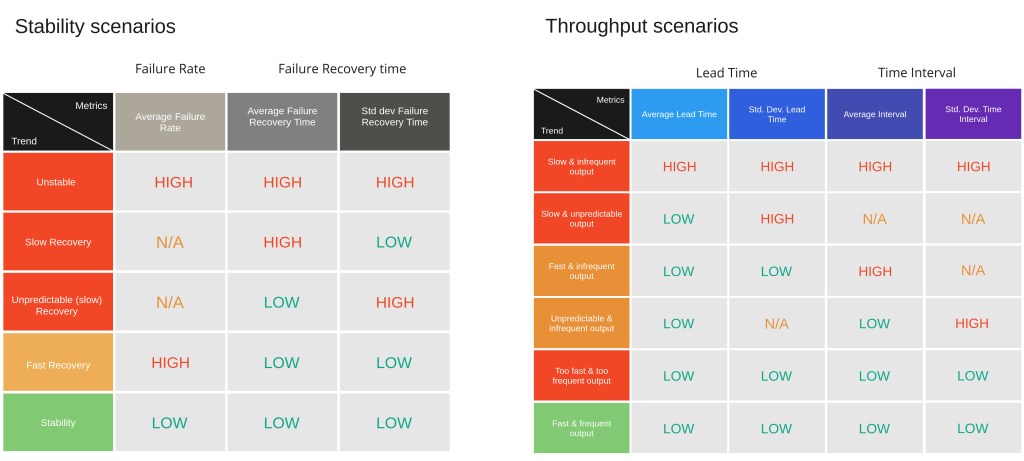
Based on the quantitative analysis and the scales that you created, it must be possible to identify which scenario correspond to the delivery process of your software product life cycle. Such scenarios allows to build a common understanding about the delivery process performance status across the entire organization, where to improve it as well as the target scenario you would like to go next.
Take the above scenarios (on the first column) as examples. Some might not be relevant to you. At the same time, try to describe each one of them in simple words so the entire workforce understand them.
You have now all the tools to describe the performance of your delivery process, both quantitatively and qualitatively, as well a simple way to describe your current and target condition (where you want to head to). This coming last step is about how to get from one scenario (current) to the next one (target) iteratively.
4. Apply a data driven improvement kata to optimize the delivery process.
How do we move (improve) from our current scenario to the target one? Data driven improvement kata is my default answer.
Once you introduce metrics in an organization, there is a high risks to fire up a race among different groups at different levels to make their own interpretations of the data, to improve specific parts of the process locally. This behaviour frequently lead to incompatible measures taken at different parts of the system, which frequently lead to lower (or no) improvements than expected which is reflected by our system level metrics. Defining a coordinated improvement kata, including a shared understanding of the current and target scenarios is a must.
In the same way that it was not my intention to go over details here about throughput and stability, it is far from my intention to go over details about an improvement kata. Please check the reference section to learn more about it. A few things though are important to mention.
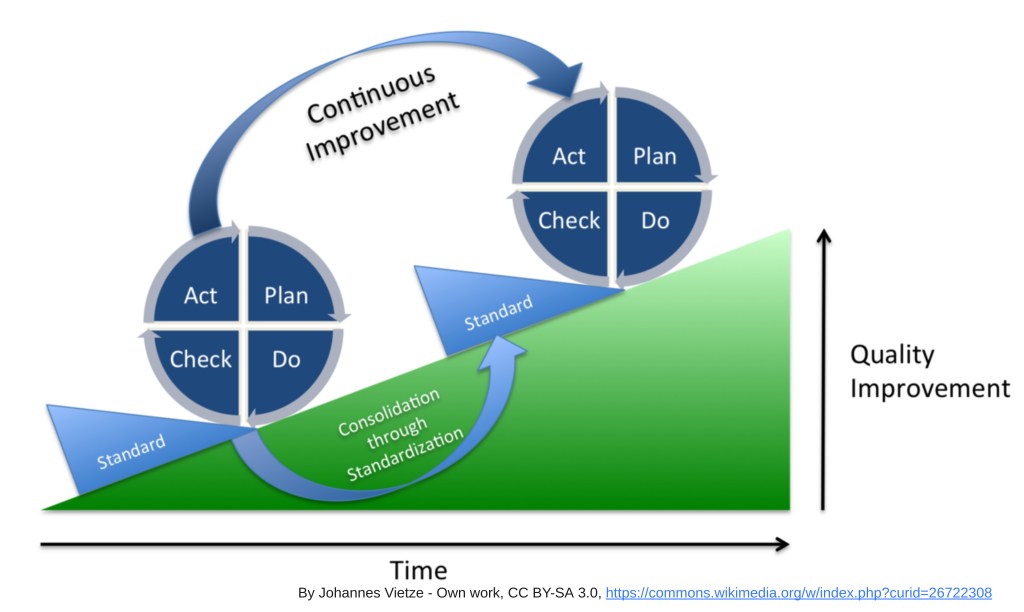
The steps of the improvement kata are, essentially:
- Understand the direction or challenge.
- Grasp the current condition (scenario).
- Establish the next target condition (scenario).
- PDCA cycle to experiment towards the target condition.
I suggest to include in the first step of the kata the business and product success picture for the current cycle. Usually the business cycle is a year. The product cycle could be a month, two, a quarter… depending on the product and organization. The experimentation cycle should be restricted to a single sprint. It it takes longer, slice the experiment so it fits in a single development sprint.
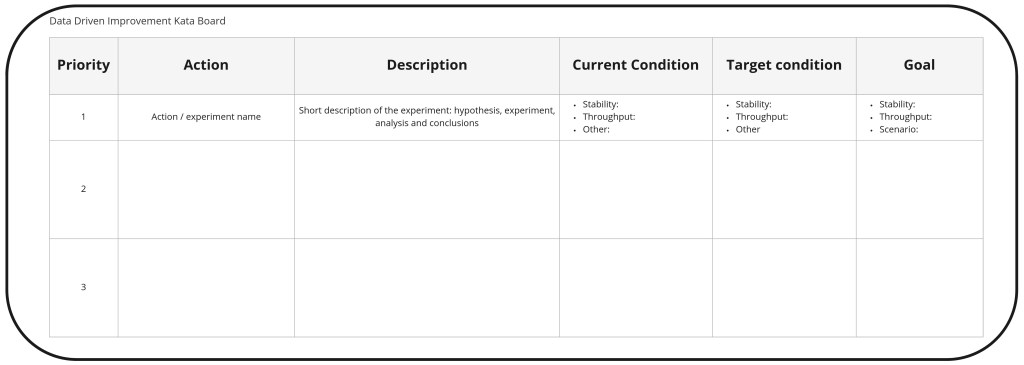
A data driven improvement kata requires to describe the current scenario, the target one, the hypothesis of the experiments and their results based on the metrics from the mathematical construct (better) or proxy ones. For our example we will assume a simple organization that works in short sprints and uses throughput and stability as key elements of the mathematical construct (metrics) . Our improvement kata should be structured using such cadence.
I like to represent any improvement kata through boards, as a summary. Here is a simple one you can start with. These boards should be visible and understood by the entire workforce. Treat them as a living document.
We will be able to learn a lot about our delivery process with this simple model. We will also improve the delivery process in several iterations, but at some point, a richer model will be required. It will be then time to bring our model one step “closer to reality”.
6. Add complexity to get closer to reality. Then go back to point 1.
This point will be the meat of the second article of this series.
Summary
We have justified the relevance of starting simple when evaluating the performance of our complex delivery process. We have created the simplest possible model to start our analysis with. We described such model as well as a mathematical construct to characterize it. Some considerations were provided about how to perform the measurements and plot the results as part of a quantitative analysis.
We learned how to move from a quantitative to a qualitative analysis and why. Once the qualitative analysis is done, we defined a data driven improvement kata to improve the performance of our delivery process iteratively. Such kata is summarized in a simple board.
In essence, this is a process any organization can follow in order to improve de performance of their delivery process effectively. If you are not able to say out loud what has been your Throughput and Stability the past quarter, last month, yesterday, today… your delivery process is not “under control”. In such case, it is hard to imagine that you will be able to improve it in a meaningful way for the business and your developers.
Go to the second article of the series.
References
There are countless references to consider, but most (if not all) ideas from this and the coming article are taken or summarized in the following references. Some of them are included in the Reads section of this site. The main references are:
- Measuring Continuous Delivery, by Steve Smith.
- Video series about Continuous Delivery from Dave Farley.
- Leading The Transformation. Applying Agile and DevOps principles at scale, by Gary Gruver and Tommy Mouser.
- Toyota Kata: Managing People for Improvement, Adaptiveness and Superior Results, by Mike Rother.

Hi great reading your postt
LikeLike
Of course, fixed. Thanks.
LikeLiked by 1 person
Please, it’s Feynman not Faymann.
LikeLiked by 2 people