Yesterday Luis Cañas Díaz and I had the opportunity to share what we have learned applying Business Intelligence to software production systems — first in open source projects, then in the automotive industry.
Context: The Invitation
Luis and I were invited to participate in the Shifting Gears with SDV webinar series, organized by the Eclipse Foundation’s Software-Defined Vehicle (SDV) initiative. The session took place on June 3rd, 2026.
The goal of the talk was to summarise our experience applying Business Intelligence (BI) to improve software production performance. We drew from our work in open source environments and from our more recent work in the automotive industry, including a study we conducted for the Automotive Grade Linux (AGL) project, published on their wiki.
Watch the video. The slide deck is available here
The BI Journey and the Methodology
The core of the talk was the BI Journey: a progressive approach that transforms raw data into actionable insights across five stages. The first three — data collection, descriptive analytics, and diagnostic analytics — look backward and describe what has happened and why. The last two look forward, enabling prediction and prescription. We focused on the first three, since that is where most most of our work has focused on and where most of the practical lessons live.
The methodology we follow to execute these stages is mostly systematic. It starts with Value Stream Mapping, moves through data type identification, process modeling, and data hub construction using Bitergia Analytics, built on GrimoireLab. It continues with a metrics matrix that covers the software production system end-to-end, we move into visualizations, structured in dashboard so we can end the second stage, the descriptive analytics with a report. That report includes the main questions that comes out of that description, which feeds the diagnostic analytics stage. Given that the methodology is less systematic in the Diagnosis stage, we provided less level of detail of the methodology we follow there.
The slide deck includes examples of these steps from real projects, including the AGL study.
Analysis Examples
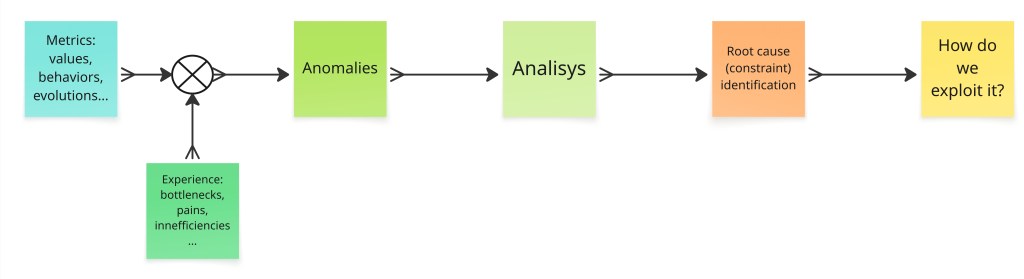
We prepared four diagnostic use cases drawn from real projects: build wait times, code review performance, variability across contributing organisations, and hidden dependencies between teams and files. Each one illustrates how data surfaces symptoms, how investigation leads to root causes, and how root causes point to actionable remedies. We only had time to go through two of them, which was great. We expected no time for this section, which is why we skipped initially.
Experiences and Lessons Learnt
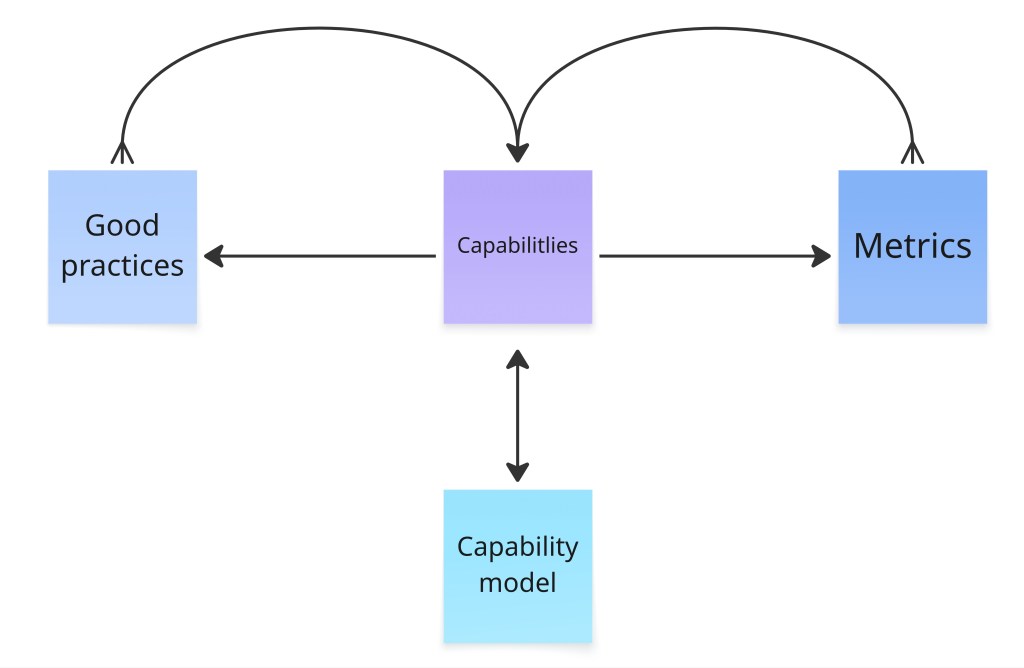
The second half of the talk covered the lessons we have accumulated across projects, organised around data and tools, metrics, visualizations, insights, and a few broader topics, including the role of open source, the AI prerequisite, and the risks of misusing metrics.
If there is one thread running through all of them, it is this: simplicity and end-to-end visibility matter more than sophistication, at every stage of the journey.
Takeaways
The talk closed with five takeaways that I think are worth repeating here.
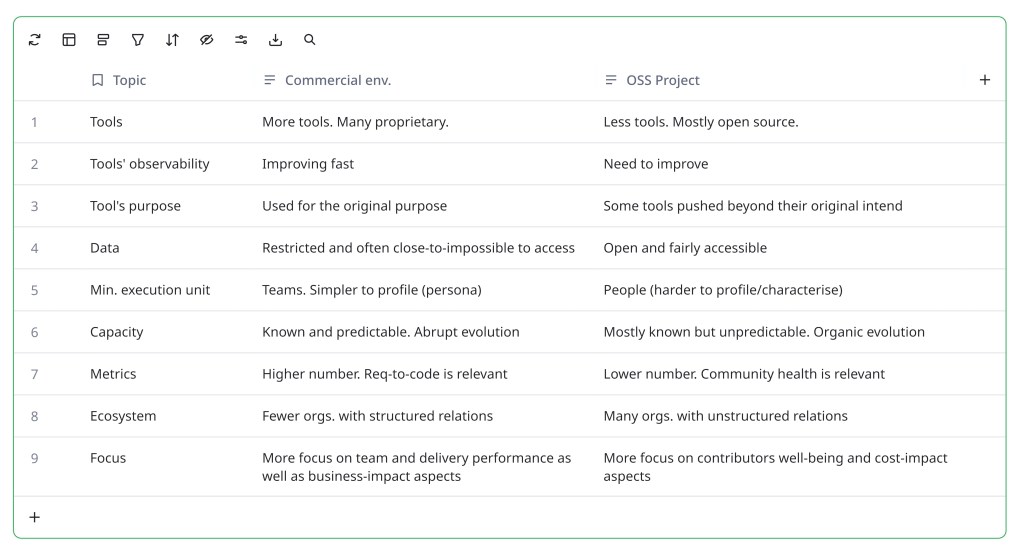
- Applying BI to improve software production performance works equally well for open source communities and commercial organisations, including those in the automotive industry.
- Software production system data should be part of your organisation’s overall data strategy, not treated as a separate engineering concern.
- Keep focus on the key goals: reducing time-to-market while simultaneously improving product quality, innovation rates, and staff well-being.
- Simplicity and end-to-end visibility are essential at every stage of the BI Journey. Start simple. Stay horizontal before going vertical.
- Do not start the house by the roof. Stages 1, 2, and 3 are prerequisites for applying machine learning and AI successfully in the predictive and prescriptive stages.
Watch the video
Thank You
Thank you to the Eclipse SDV for the invitation to participate in the Shifting Gears with SDV webinar series. It is always good to be back to Eclipse Foundation’s activities. Collaborating with Luis Cañas Díaz is always a pleasure. His expertise and his ability to explain complex ideas clearly made the talk significantly better.
Summary
Luis Cañas Díaz and I presented at the Eclipse Foundation’s Shifting Gears with SDV webinar series on June 3rd, 2026. We shared our experience applying a systematic BI approach to software production systems — from open source projects to automotive product development. The talk covered the BI Journey methodology, four diagnostic use cases from real projects, and the lessons we have learnt along the way on data, metrics, visualisations, and insights.
